April 25, 2021
It all started when we decided to go with D3 (and not with Chart.js or Google Charts!) for a project that aimed to help organizations run ad campaigns more smartly. A big part of the project focused on providing visualizations to enable customers see important trends and patterns that are not discoverable otherwise.
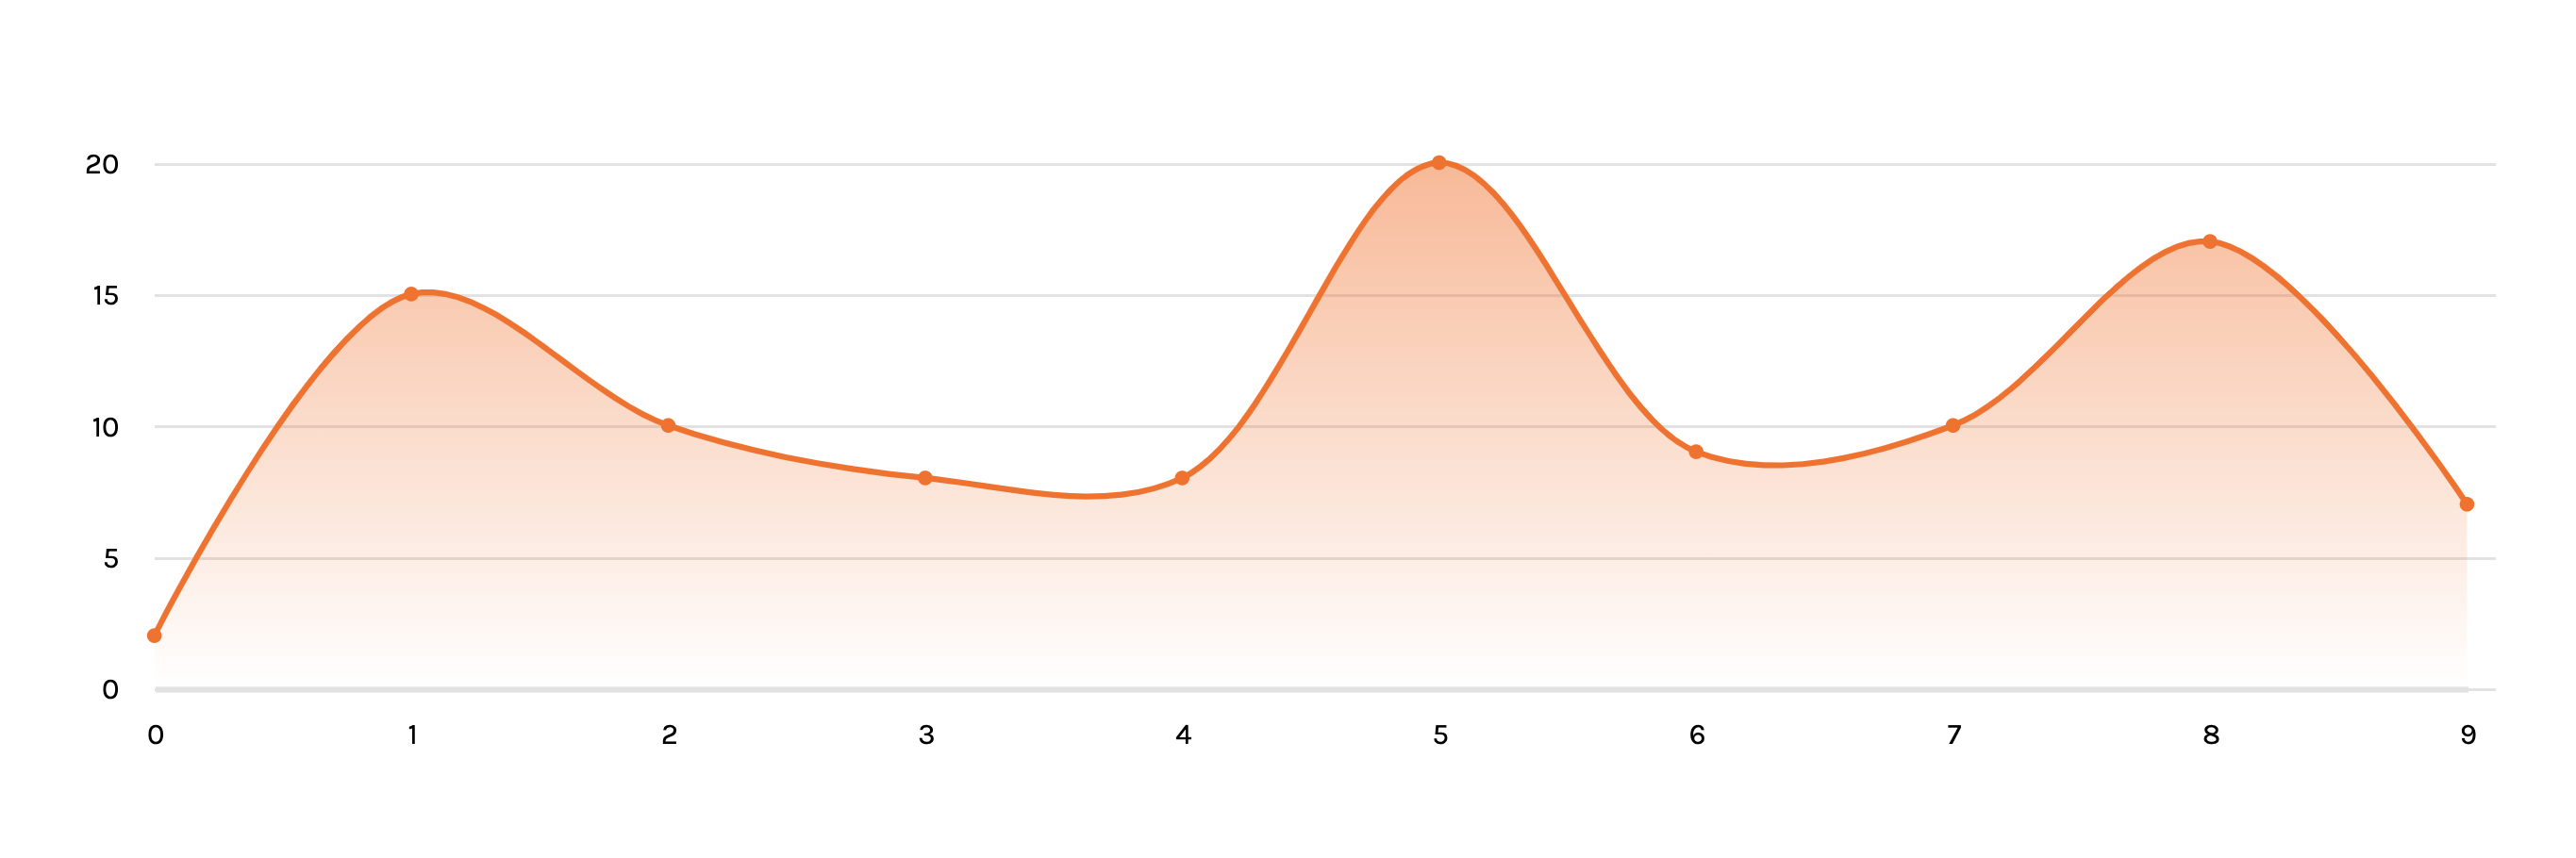
Our design team had come up with some graphs and plots to best visualize the kind of data we were dealing with. One of the graphs looked like this:
Before starting to develop the graphs, I was a bit worried because I wasn’t sure:
- Whether D3 will be able to support all the customized graphs we have designed?
- How hard it’d to make changes to the graphs once they have been implemented?
So, to find the answers, I began – started looking at some examples and tried to get them to run in our project, with the data we had. It took some time (about a week) but I was able to build an understanding of the core philosophy of building diagrams with D3. When this happened, I was amazed, the idea is so natural that I felt like this is how graphs should be built!
At the core of D3 are Scalable Vector Graphics, or SVGs. The vector part in the name tells that each pixel is defined as a point on a Cartesian plane, that is, we have a pair
(x,y)that defines the position of point in a plane.
Also, the data to be plotted can also be seen as a collection of points ﹣ it generally has an independent value and dependent value, represented on the x- and y-axis, respectively.
When you find yourself comfortable with the above two statements, D3 can be seen as a set of utilities that just takes your data and maps each data row to a point in a Cartesian plane. Consider the following data,
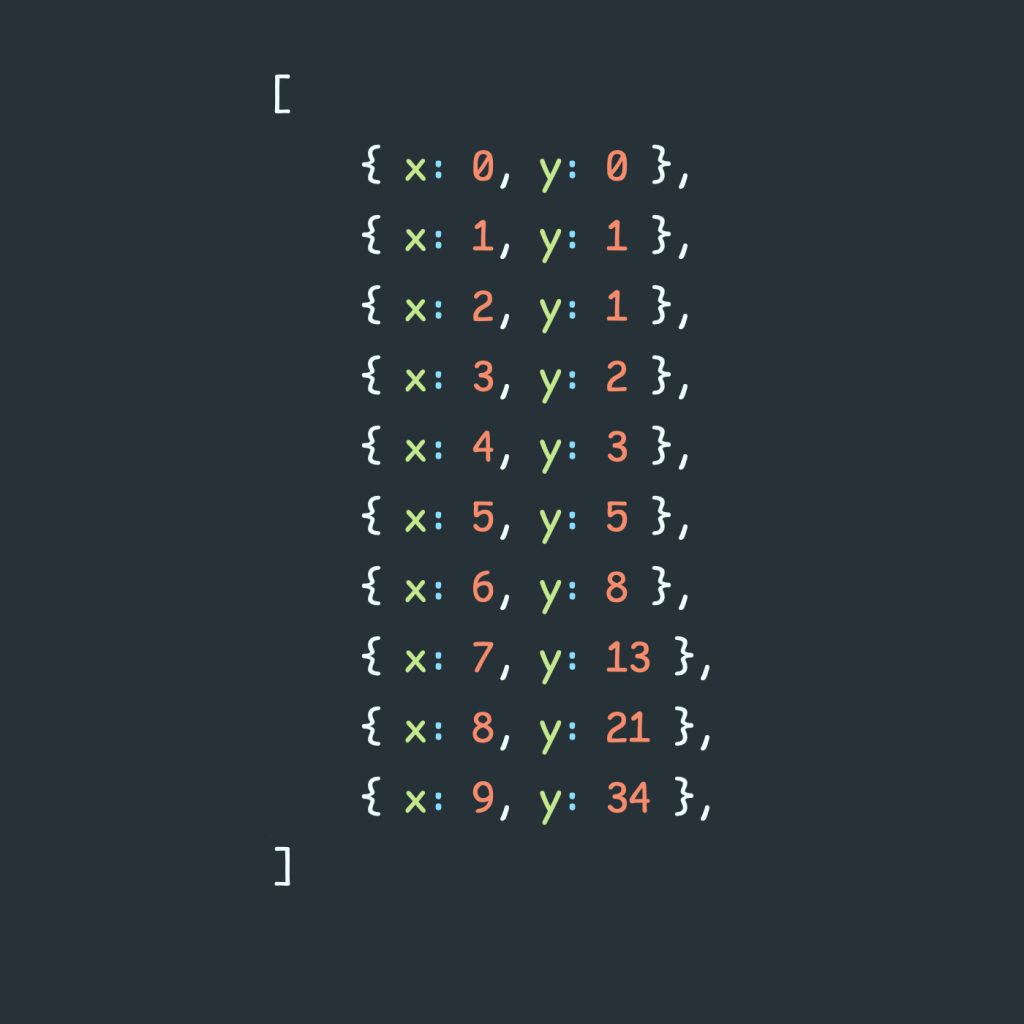
Now, this data can be passed to D3, and the x, y coordinates of the points can be calculated. These coordinates, for example, can be passed to the cx and cy attributes of the circle element of the SVG.
So, in this way, I saw a very natural connection between the data and how SVGs are created. And with this understanding, I’m not surprised that D3 stands for Data-Driven Documents.